
Normally, I evaluate measured strain time series to calculate a stress range spectra or the damage. But today I evaluated the temperature rise with Julia (https://julialang.org/), because I wanted to know where we are at the moment.
The temperature data used are from the Open Data Server of the German Meteorological Service (DWD, http://opendata.dwd.de/) and plotted with the in Julia integrated Plots package (https://docs.juliaplots.org/stable/). I simply calculate a trend line from 1900 to 1980 as a reference and a second trend line from 1980 to 2022.
According to the averaged temperature data from DWD (http://opendata.dwd.de/climate_environment/CDC/regional_averages_DE/annual/air_temperature_mean/regional_averages_tm_year.txt), the 1.5°C limit has been exceeded 4 years ago and we are already on the path to 2°C. Even the data for the Hamburg area do not look better.
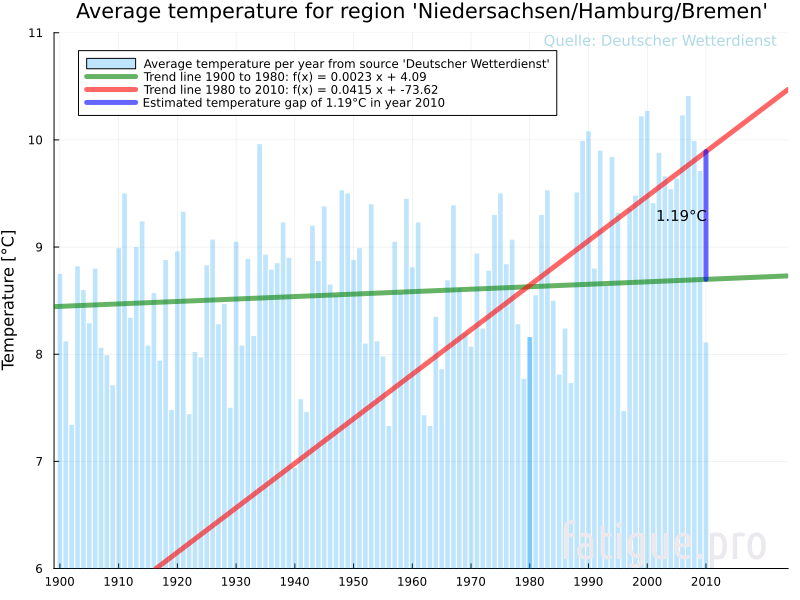
It is quite interesting that the crossing point remains quite stable at the year 1980. So the ongoing trend has started around 1980.