
I used the latest Fatlab version from https://sourceforge.net/projects/fatlab/ and customized it a little bit. If you need more information about Fatlab then check also http://fatiguetoolbox.org. First of all I ported the Fatlab version 2.070 to Linux, because I doing most of the calculations on that platform. Except for Windows-specific peculiarities (like “3D connexion mouse” support), everything works fine after some small modifications.
But i added also a bigger change to be able to use Matlab *.mat files as load files instead of spreadsheets in a Excel file. That is much faster and the usable length and the usable number of Fatigue load cases (FLC) are nearly unlimited.
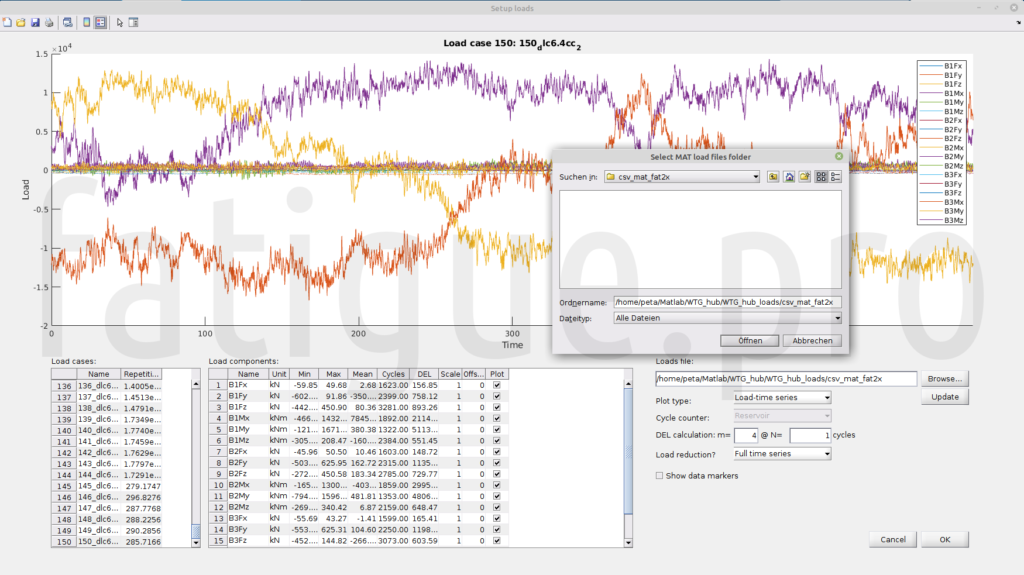
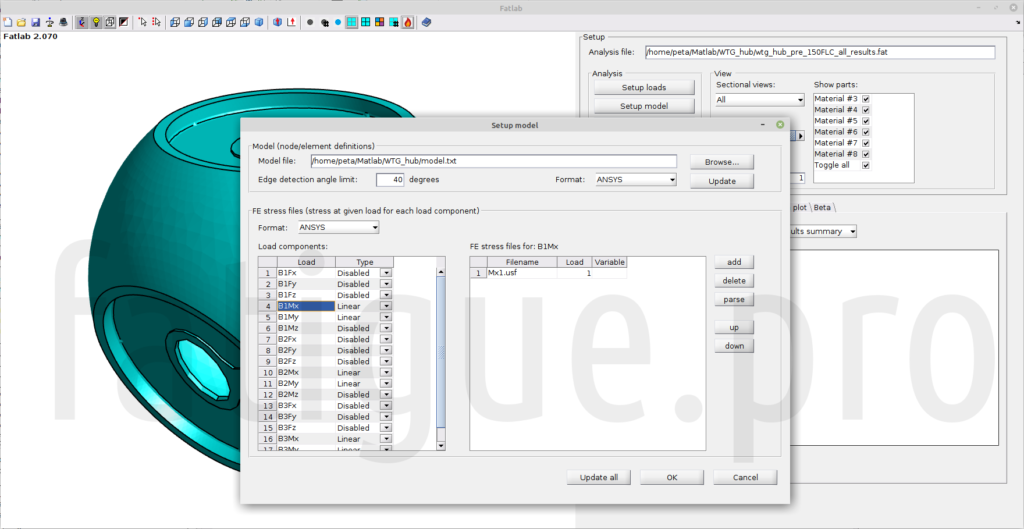
For that that wind turbine example, I used 150 Fatigue load cases with 18 load components. The rest of the model is similar to the Fatlab example (see http://fatiguetoolbox.org/fatlab/examples/example-wind-turbine-hub). I use the same FEM model and the same stress files, which are loaded in the same way (only the blade bending moments Mx and My).
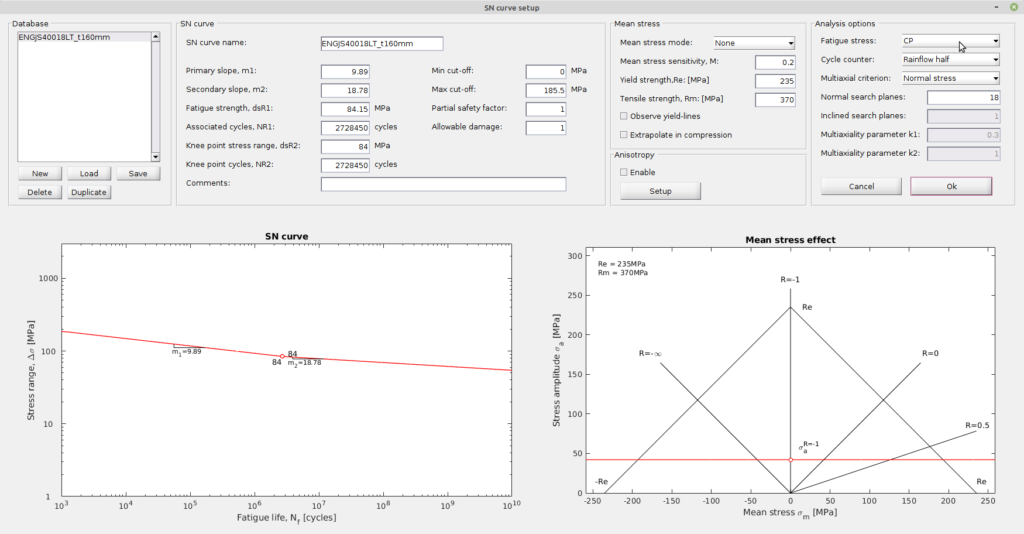
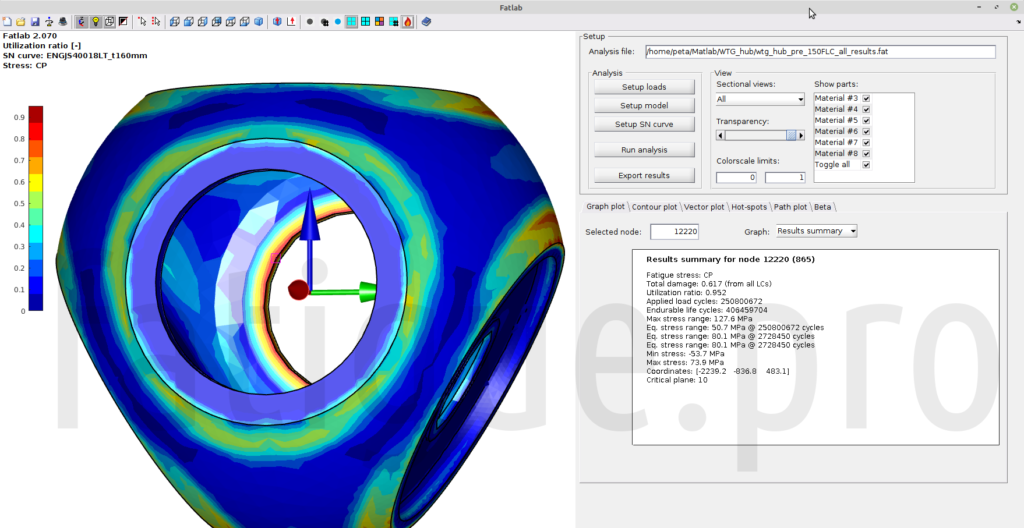
Then we need a SN curve for the material EN-GJS-400. I used a synthetic SN curve as described in IEC 61400-4. We select no Mean stress correction and the Critical Plane (CP) approach with “Rainflow half” and “Normal stress” with 18 planes (more information in the section “5 Theory reference” of the Fatlab manual https://sourceforge.net/projects/fatlab/files/FatlabManual.pdf/download).
Now we are ready for the calculation run. We can select all available physical cores in the “Parallel run:” option to get the solution as fast as possible.

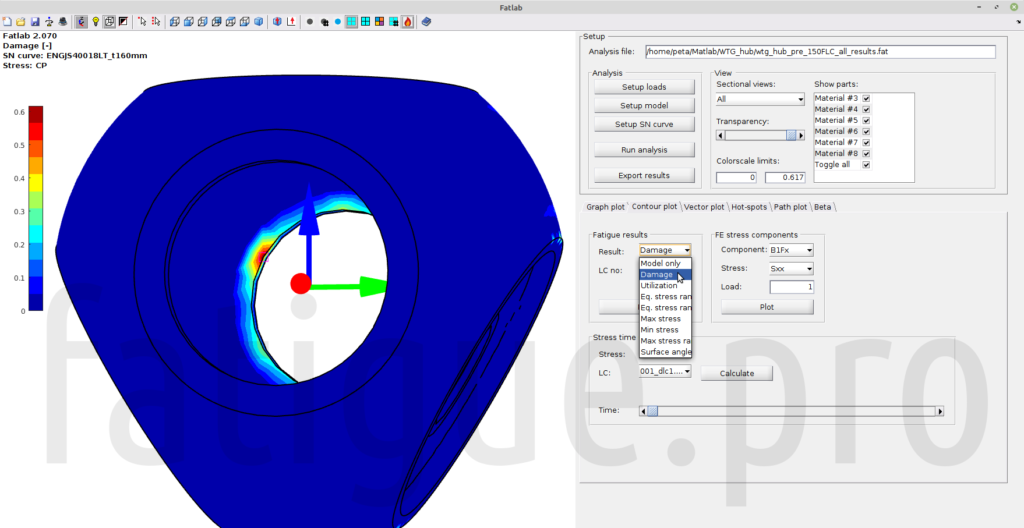
The results are directly available after the solution run. Maximum damage are inside the man hole in front of the hub.
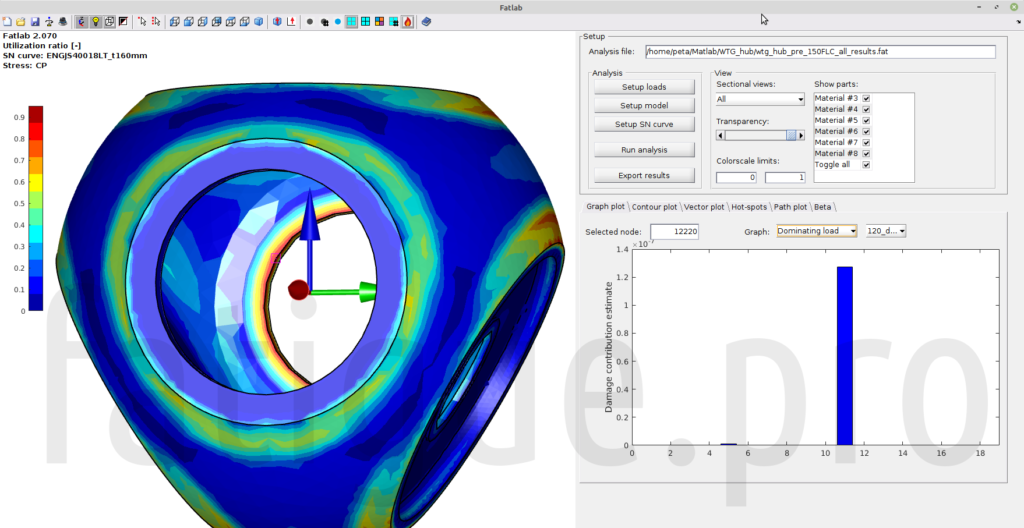
And the maximum partial damage can be found with the used loads at FLC 120. The partial damage plot is also slightly modified, to show the right load case numbers.

Because of an additional modification we are able to check the dominating load component for that node and the most damaging FLC 120 even with the CP approach. Load component 11 is B2My according the loads (see the 18 load components in the load setup window).
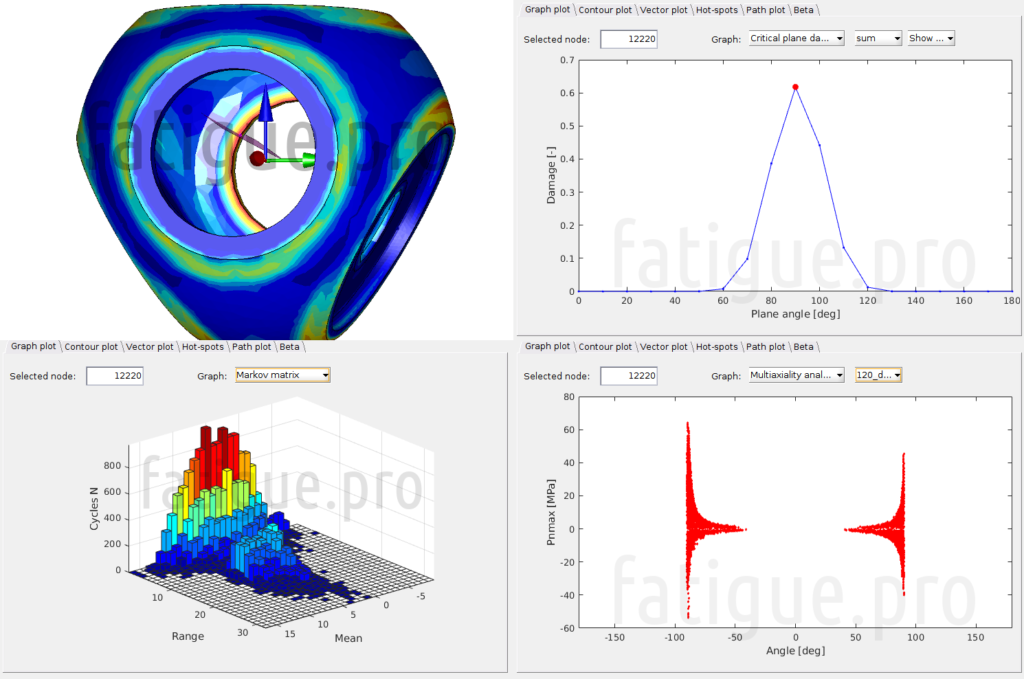
We can check more interesting results on that node. In the upper left corner you see the most damaging critical plane and beside the plot with the damage per critical plane angle for all FLC (damage summed up). In the lower left corner is a Markov matrix with the counted cycles per stress range and stress mean. And in the right lower corner is the Multiaxiality analysis for the most damaging FLC. If you are interested in more result options, then check the section “4 Evaluating Results” of the Fatlab manual https://sourceforge.net/projects/fatlab/files/FatlabManual.pdf/download.
If you are interested in a complete simulation procedure with ANSYS and Fatlab/Matlab you can check these video https://www.youtube.com/watch?v=yvIt-z2rzyc&t=8s on the YouTube channel from Mikkel Pedersen (https://www.youtube.com/@mikkelpedersen9939).