
About five months ago I started with a steel wheel in PrePoMax. There you can find more information about the design and model setup. Now i reused these wheel geometry and prepared a new mesh in the latest available version 2023 R2 of Ansys Workbench.

For a fatigue calculation I need more load cases and the load must rotate around the wheel to simulate rolling. Even with a tire or a tire model it is a bit tricky to create a moving load. Moving load is typical for load on a bridge or on a floor of a building (Moving load in Wikipedia). I solved that with a Mechanical APDL programming Command.
Now i can create any number of load cases around the 360° of the wheel and i can vary the angle of the load distribution. The Angle and shape of the load distribution are dependent on the tyre and the condition of the road. Even the solution of this large number of load cases is defined inside the APDL command snippet.

With that approach we are able to simulate the dynamic radial fatigue test according ISO 3006 (Europe) or SAE J328 (US). In this test, a constant radial force Fr is applied. And the wheel is turned with a driven drum.

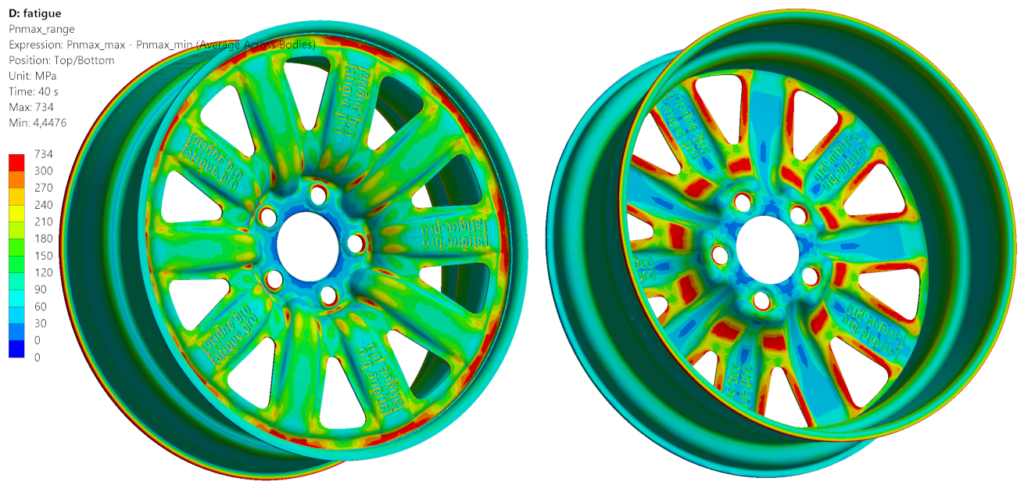
The results are available inside Ansys Workbench and so we can use all the results and post processing features. So we can also create plots of the maximum absolute principle stress. In Fatlab this is called “Pnmax: Numerically largest principal stress (between P1 and P3)”.

With the integrated “Maximum over time” and “Minimum over time” function we can get the minimum and the maximum stress for every node over all load cases. And from that we can calculate the first simple fatigue result: the stress range with Pnmax_max – Pnmax_min. Here you can already check whether the calculated stress range is greater than the allowed stress range.
With a S-N curve according DIN EN 1993-1-9 we can direct calculate a fatigue stress
ratio in Ansys Workbench with UR = calculated stress range / allowable stress range at given cycle number. That is comparable with the “Utilization ratio” in Fatlab at the knee point of the SN curve.
400000 test cycles (wheel revolutions) are specified as “minimum cycle requirement for wheels in normal highway service” with material “Ferrous” in SAE J328 standard. For the highest possible fatigue class 160 we can derive an allowable stress range of 274 N/mm² at 400000 cycles.

Now the stress range plot can be converted with the allowable stress range of 274 N/mm² at 400000 cycles in a utilization ratio plot.

And with the slope of the SN curve (m1 = 3) we can also calculate a damage plot within Ansys Workbench.

Damage plot and Utilization ratio plot showing values above 1.0. So our calculated design would not have been passed the dynamic radial fatigue test. Now it would be possible to reduce the loads and/or optimize the critical areas.