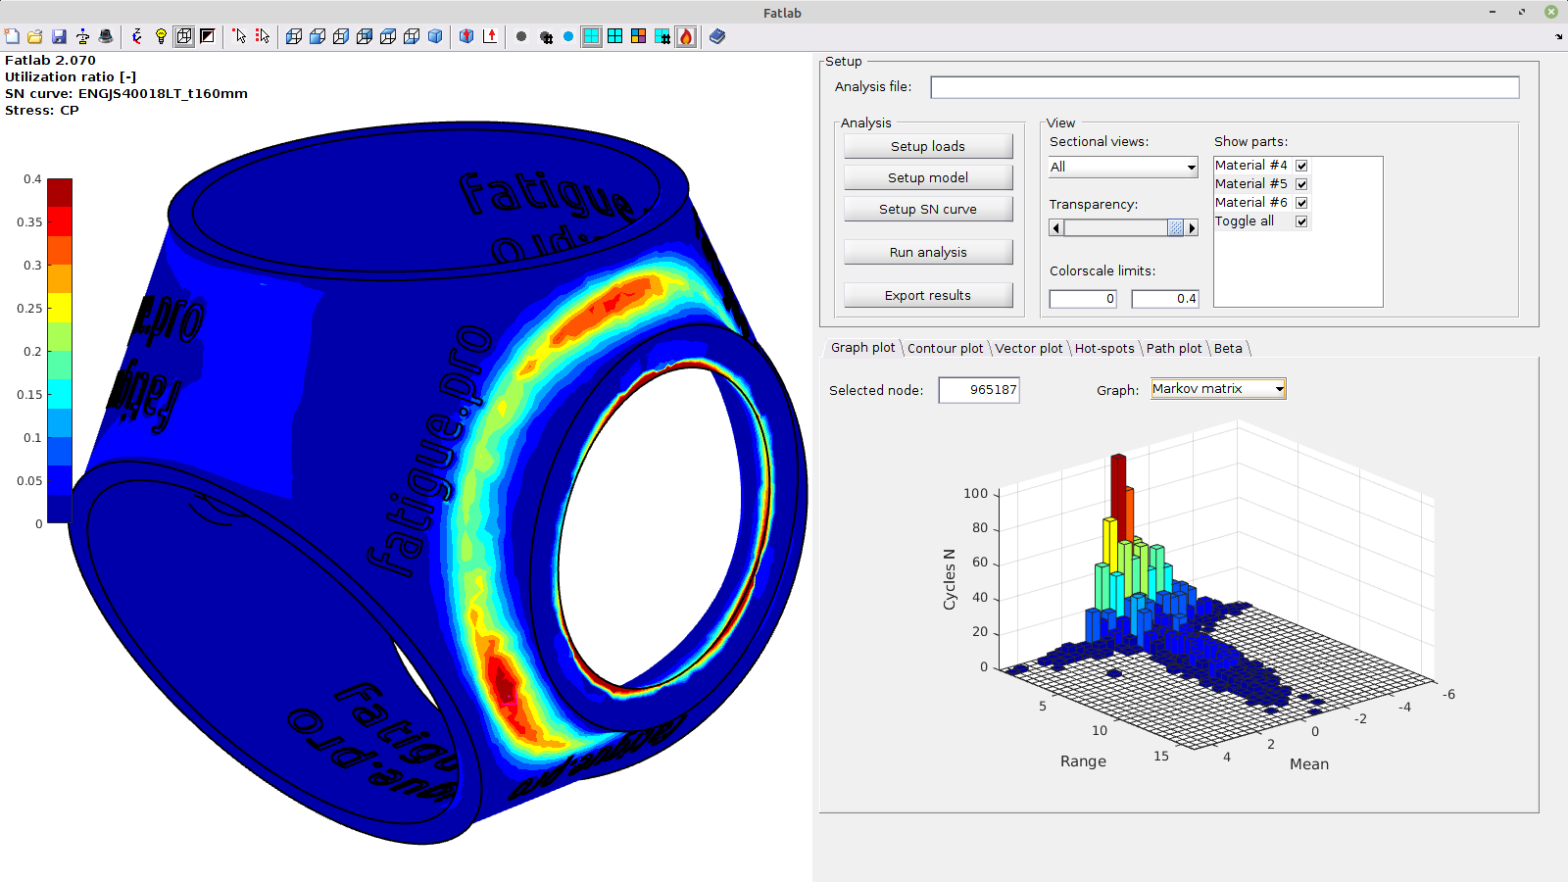
Finally, my CalculiX interface in Fatlab now works also for more complex results from PrePoMax. The following video shows a complete fatigue calculation run of a simple hub in Fatlab with PrePoMax (Calculix) results.
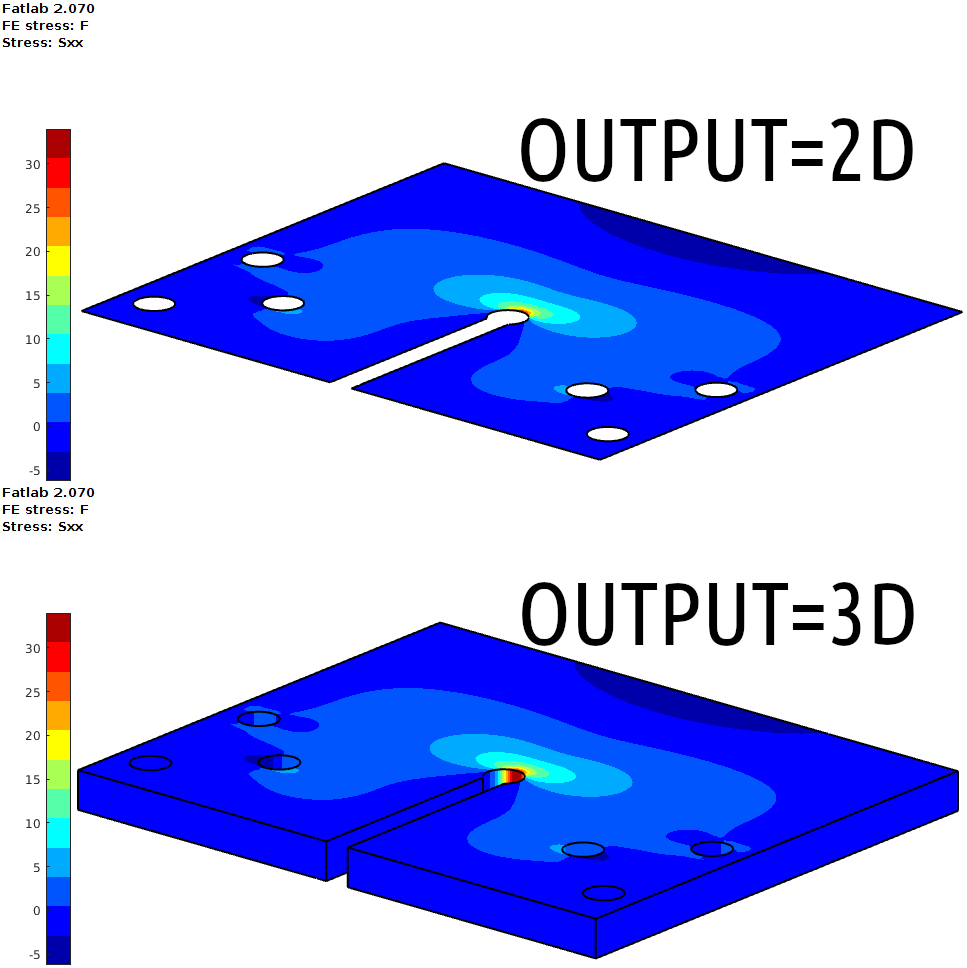
I had to rewrite the model import (nodes, elements) to the *.frd result file, because the model in the input file is not always the same as the result file. If you use shell elements then “OUTPUT=3D” on the *NODE FILE card in CalculiX is default and you get the expanded form (3D) of shell elements in the .frd file. Following figure shows the difference for the SAE keyhole benchmark. For more information on that topic you can check the “CalculiX CrunchiX USER’S MANUAL“.
Let’s finally get to the wind turbine hub results in Fatlab. You find more information about the calculation of the stresses here “Wind turbine hub calculation in PrePoMax“. And for fatigue I made a model with unit load cases of 1000 kNm in Mx and My on every blade.
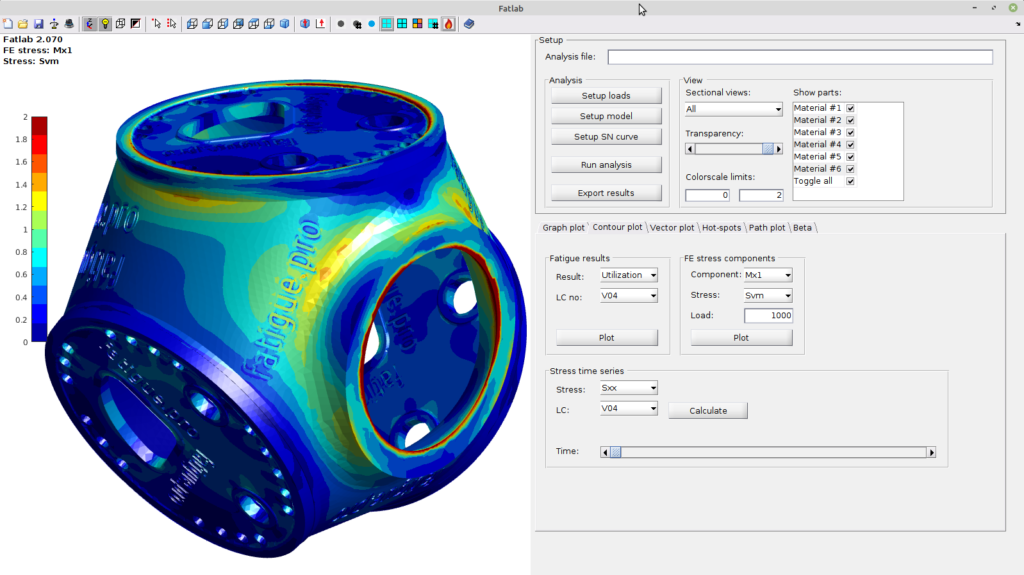
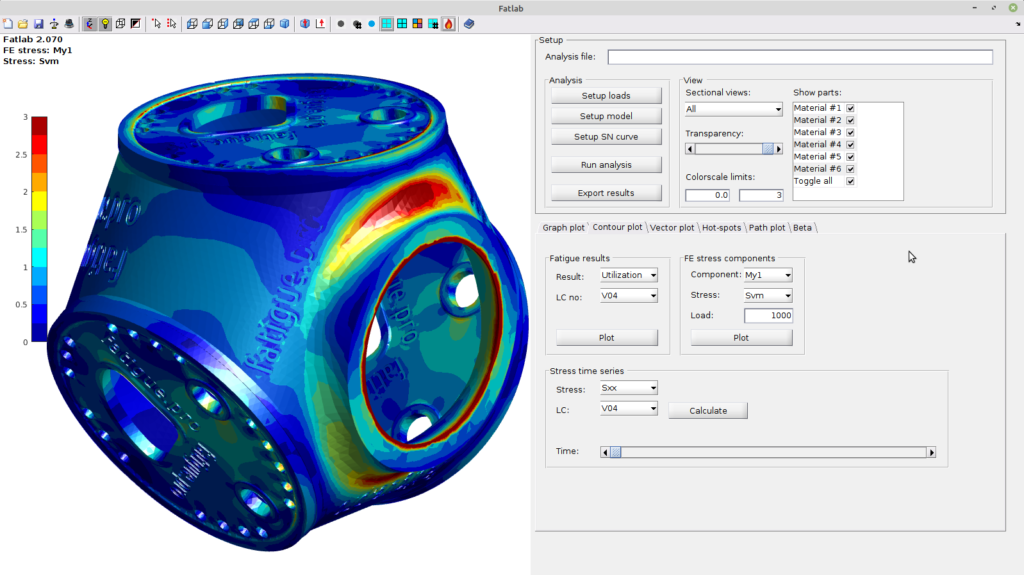
The CalculiX *.frd result file always contains all calculated nodes and elements, so it makes sense to import only the needed elements into Fatlab. If more than one material has been defined, then the interesting materials can be selected in Fatlab. So you are able to check thicker or different materials with separate setups in Fatlab.
I used the same load time series as in the “Wind turbine hub” example from fatiguetoolbox.org. And I used again a synthetic SN curve for material EN-GJS-400 as described in IEC 61400-4. We select no Mean stress correction and the Critical Plane (CP) approach with “Rainflow half” and “Normal stress”.
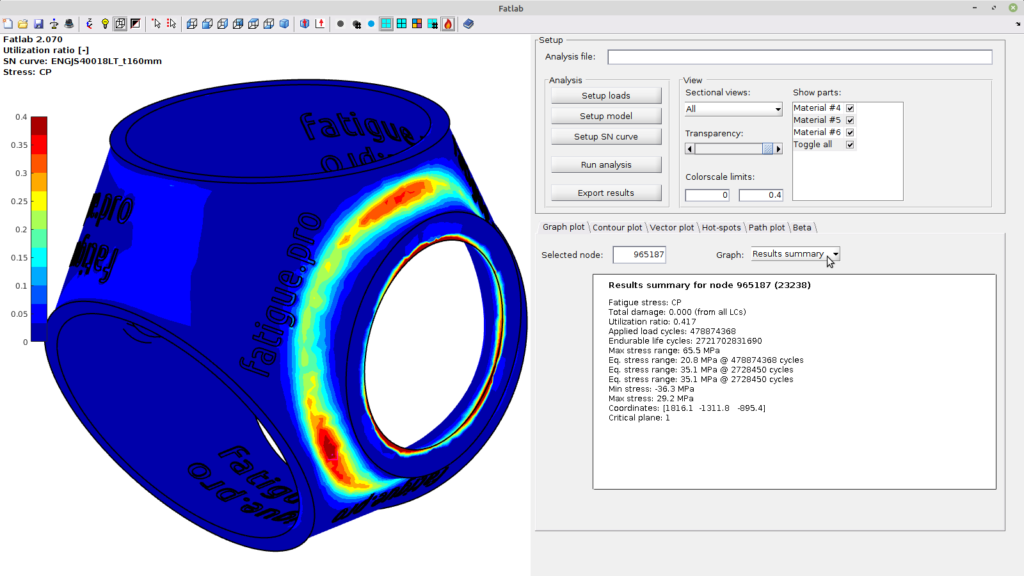
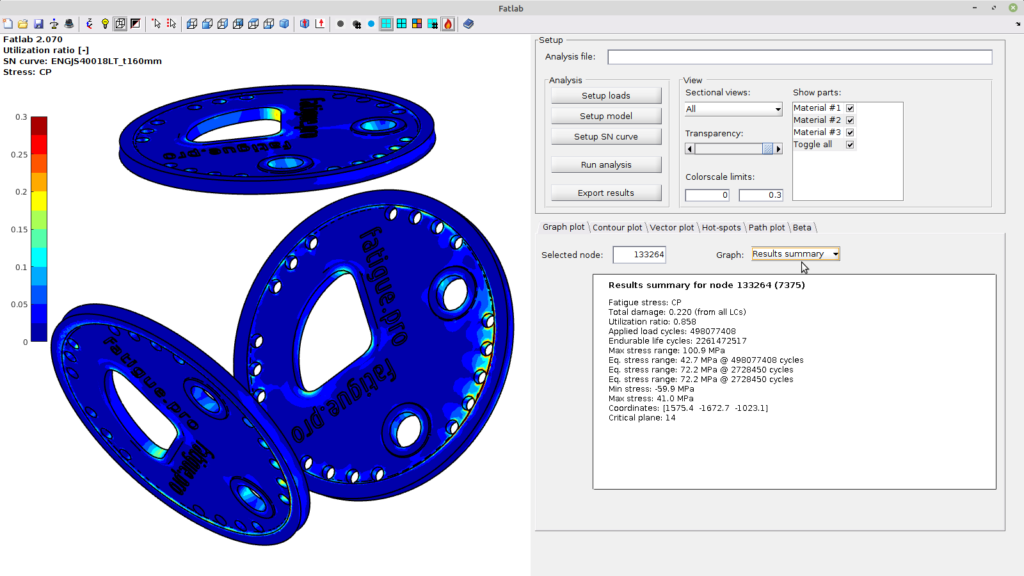
My models from FreeCAD and PrePoMax are now working perfectly. So I think the interface is ready for a first implementation in Fatlab, so others can test their models too. I will provide the source code files to the author of Fatlab.
Update 14. January 2024: It is done!
My CalculiX result interface has been now implemented in the latest version 2.122 of Fatlab (download link).
And additionally you can use now Fatlab also as a standalone “Fatlab.exe” application without a licensed copy of MATLAB.
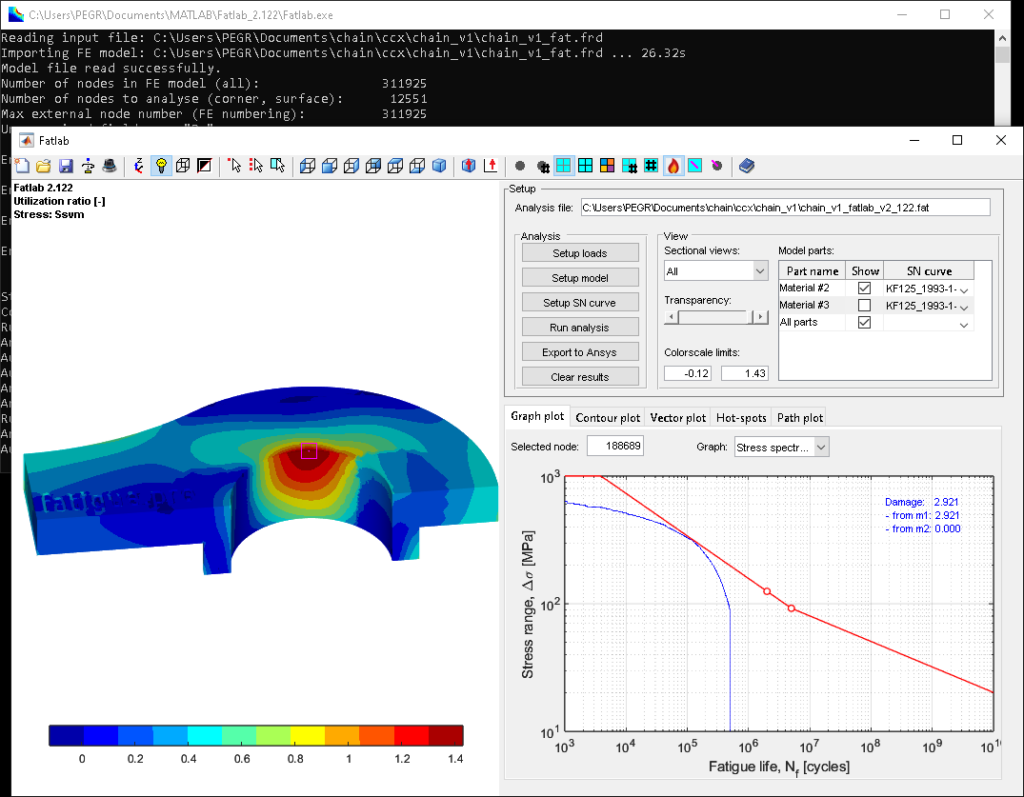
And the stress spectra plot also looks really nice now. You can find more information about my chain link calculation in my blog post “A chain is only as strong as its weakest link“.

