
If you have a simple model and load you can directly use FreeCAD FEM workbench results in Fatlab. In the previous post I had introduced the newly implemented interface to use CalculiX results in Fatlab with a first quick solid FreeCAD example. Now I implemented the support for more element types and I made a first full Fatlab run with the SAE keyhole benchmark.
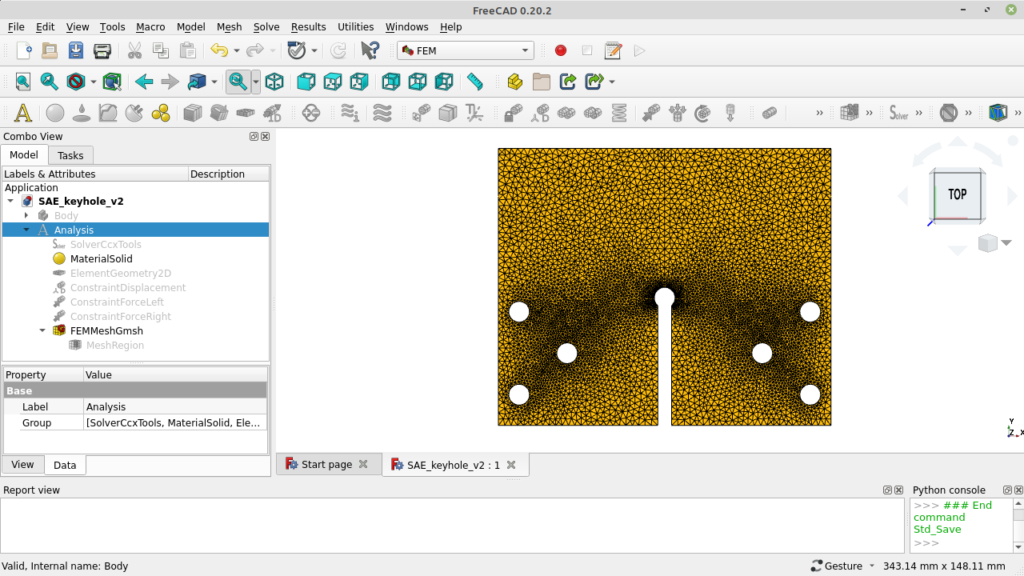
First of all we have to prepare the geometry for the SAE keyhole benchmark example. This SAE studies are adapted from efatigue.com and you find there more detailed information about that test. The used “Test Geometry” is easy to sketch in FreeCAD and will be used as a surface with shell elements.
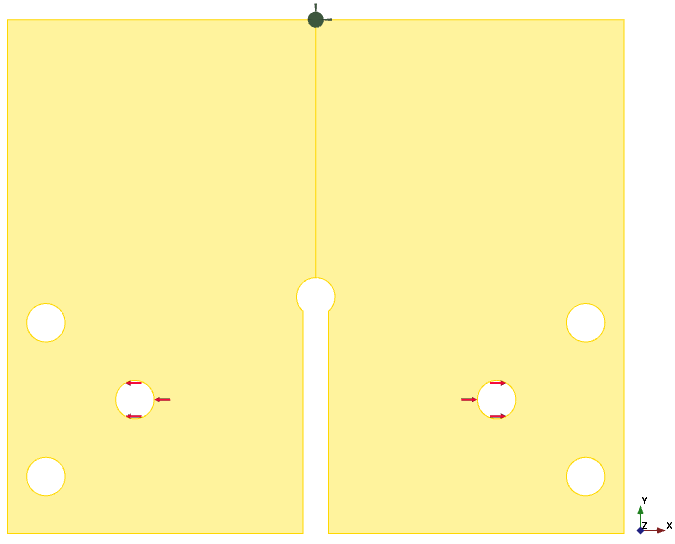
To prevent high stresses due to displacement boundary conditions we can apply the load of 1 kN in both directions. And add a displacement boundary condition only to a single point to avoid rigid body motion. With that approach we get tiny reaction forces of lesser than 2.6E-06 N in all directions and a symmetric deformation.
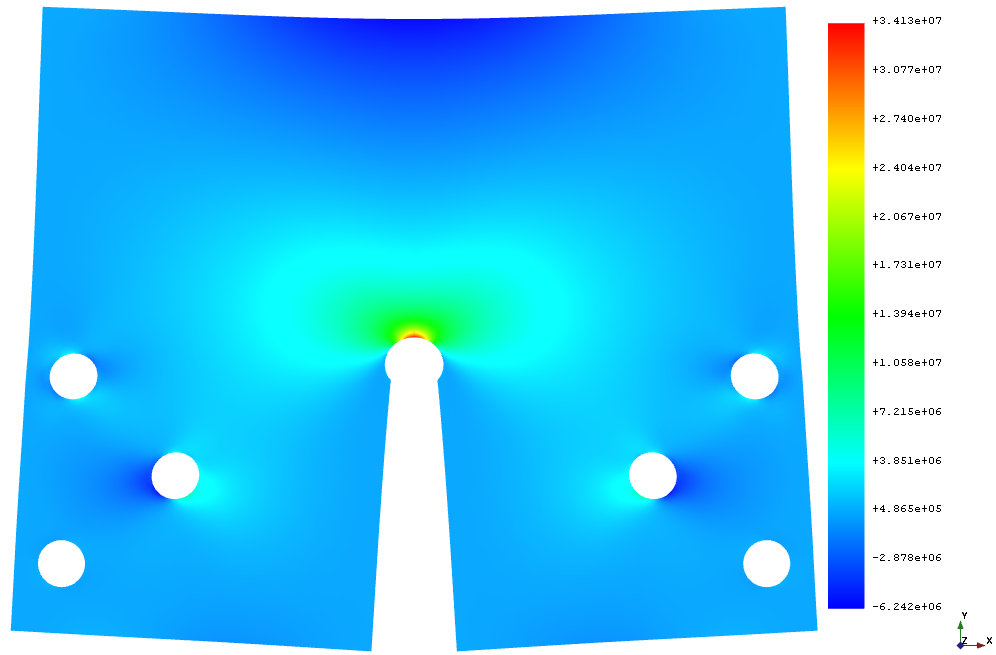
In FreeCAD we get a maximum stress in X direction of 34.1 MPa and a maximum P1 stress of 34.3 MPa. And that is very close to the estimated analytical results of 33.6 MPa.
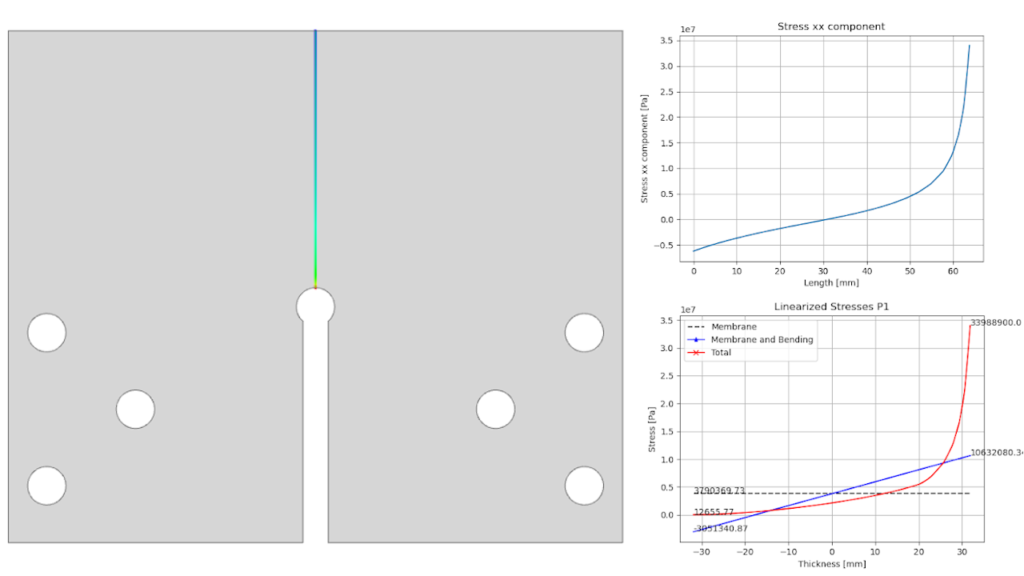
In FreeCAD we can read out the stress along a path and can do a stress linearization to check the “notch” stress concentration factor (Kt = 3 is typical for a circular hole). In the next figure we see the maximum of S1 stress with 33.9 MPa and the maximum of “Membrane and Bending” stress with 10.6 MPa on the path. So we can derive a Kt = 33.9 / 10.6 = 3.2. This value is conservative because of the usage of P1 stress for “Membrane and Bending”. With Sxx it should be the same as the analytical value of 11.2 MPa in the Stress Analysis and then it is similar to the expected value of Kt = 33.9 / 11.2 = 3.0.
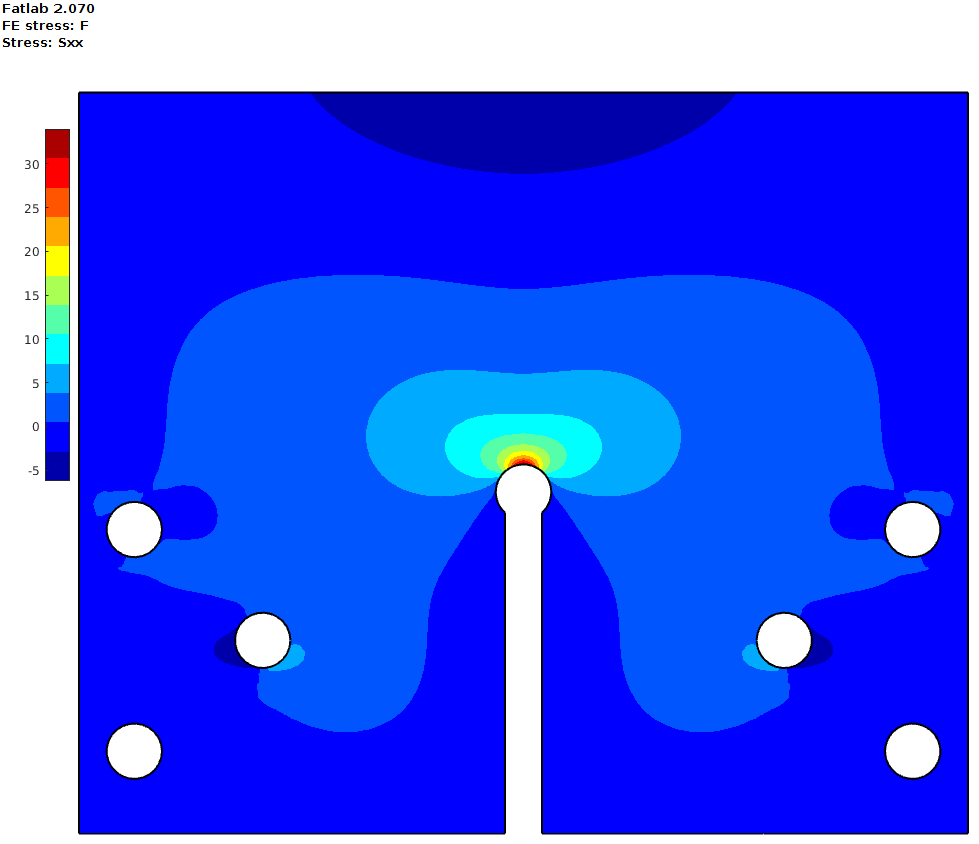
For Fatlab we reuse the CalculiX ccx input file (*.inp) and the CalculiX ccx result files (*.frd) from the “Working directory” of the “SolverCcxTools” in the FreeCAD tree. The import in Fatlab is still the same as in setup model in the previous post. And when we compare the Sxx plot of the imported stress then it looks comparable to the Sxx stress plot in FreeCAD.
As described in the SAE keyhole benchmark there are two checks for this model. One for constant amplitude (CA) and another for variable amplitude (VA) loading. The calculated utilization ratio should be 1.0, so that the estimated life is equal to the experimentally determined life.
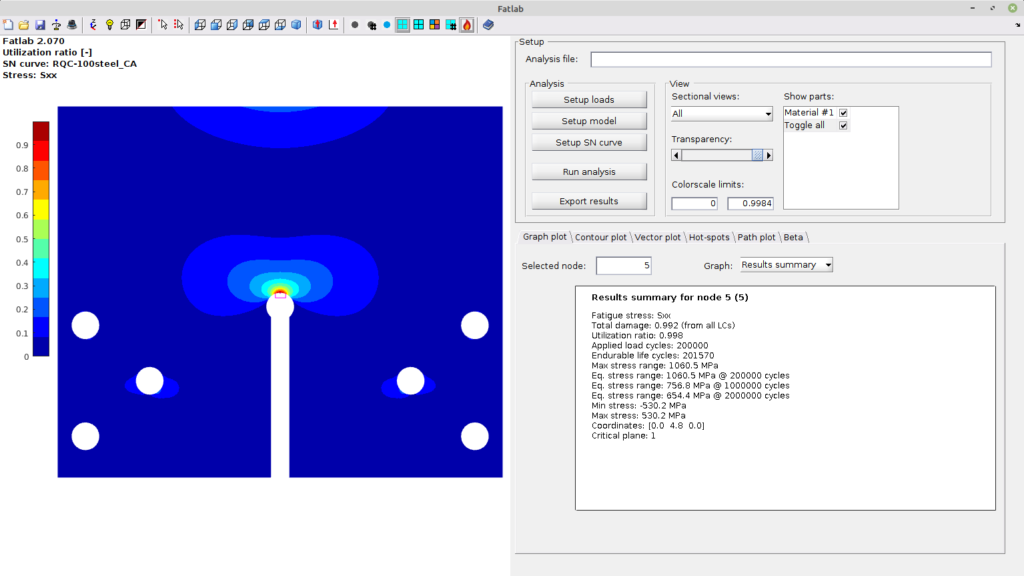
The “Results summary” shows a Total damage of 0.992 and a Utilization ratio of 0.998 for the critical node with constant amplitude loading with 200000 cycles. And Min stress and Max stress with -/+ 530.2 MPa is divided with the load of -/+ 15.6 kN the calculated stress Sxx with 33.9 MPa from the stress figures above.
The table below shows a overview of the results for different Fatigue stress approaches combined with different cycle counters.
| Specimen ID | Load | Cycle counter | UR | Damage |
| CR15 (CA) | F = ±15.6kN loads_CA.xlsx | Sxx Single cycles | 0.998 | 0.992 |
| CR15 (CA) | F = ±15.6kN loads_CA.xlsx | Sxx Reservoir | 0.998 | 0.992 |
| BR2 (VA) | Fmax = 35.6kN loads_VA.xlsx | Sxx Reservoir | 0.995 | 0.976 |
| BR2 (VA) | Fmax = 35.6kN loads_VA.xlsx | Sxx Rainflow half | 0.992 | 0.961 |
| BR2 (VA) | Fmax = 35.6kN loads_VA.xlsx | Pnmax Rainflow half | 1.003 | 1.016 |
| BR2 (VA) | Fmax = 35.6kN loads_VA.xlsx | CP (36 planes) Rainflow half | 1.003 | 1.014 |
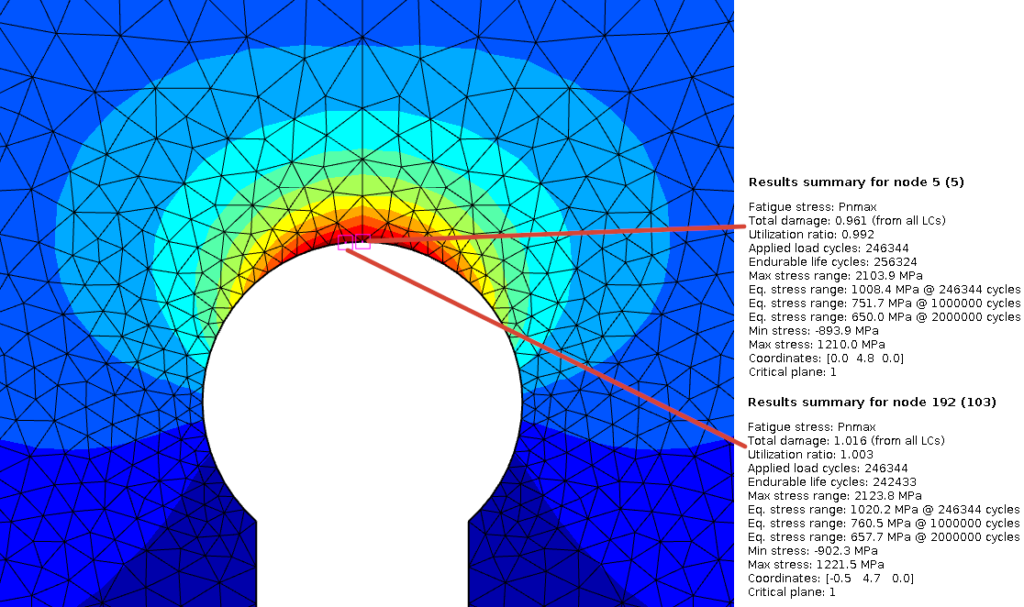
The higher Utilization ratio for Pnmax and CP approach is because of a different mesh size. The highest damaged node jumps to the neighbor node with a smaller mesh size. And with this the Min stress and Max stress changes slightly. But the node in the middle have still the same results as with Sxx stress approach and Pnmax.
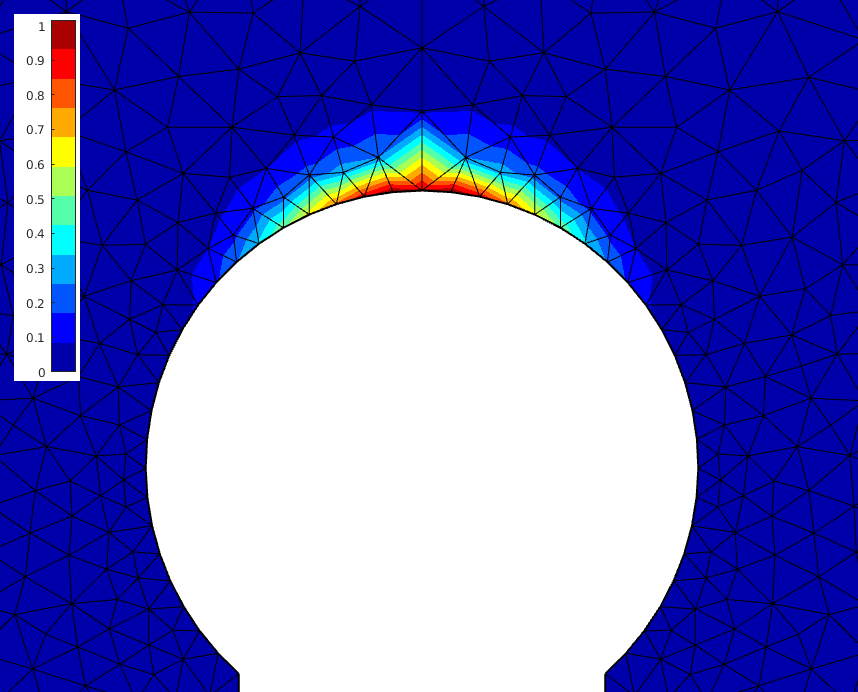
If you plot the damage then you can see the uneven damage distribution along the edge. At the node in the middle the damage of around 1.0 drops down to lesser than 0.1 over 1 element, but at the neighbor node it drops only to a damage of 0.25. This is an indicator that the middle element should be refined if more accurate results are needed.
It will take a few more tests with larger models and more load cases (e.g. wind turbine hub calculation) until the CalculiX interface in Fatlab is ready for release.
Update 14. January 2024: It is done!
My CalculiX result interface has been implemented in the latest version 2.122 of Fatlab (download link). You can find more information about my latest CalculiX interface development in my blog post “Wind turbine hub calculation in Fatlab (PrePoMax results)“.
And additionally you can use now Fatlab also as a standalone “Fatlab.exe” application without a licensed copy of MATLAB.
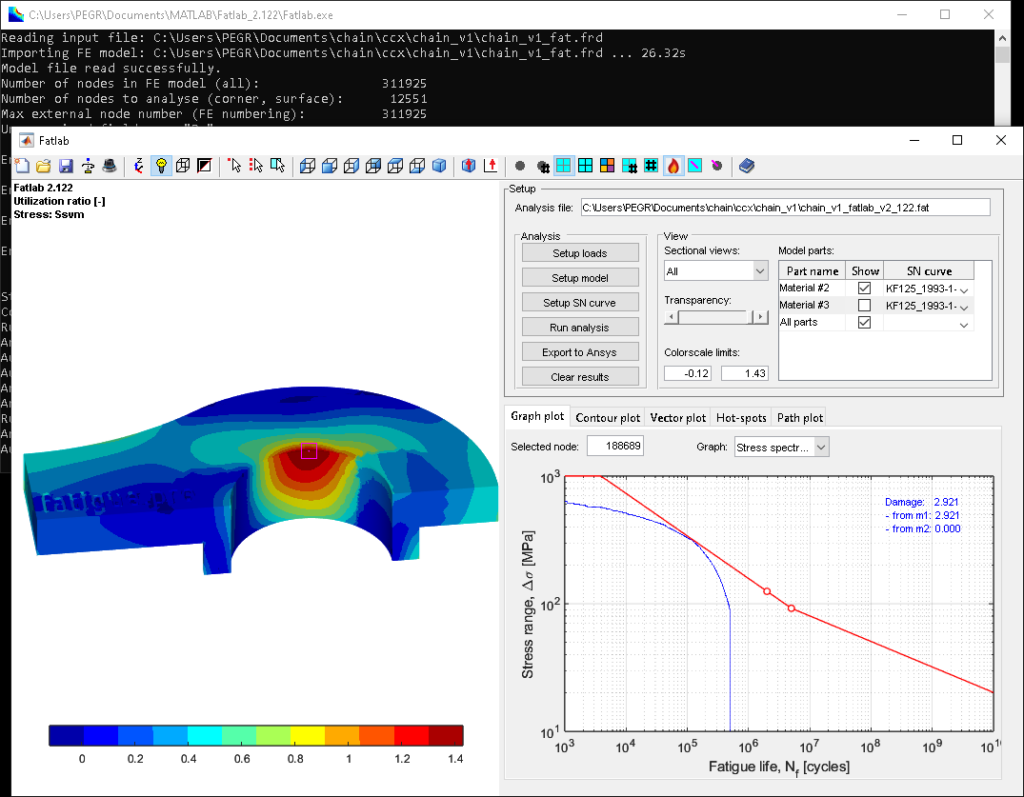
And the stress spectra plot also looks really nice now. You can find more information about the chain link calculation in my blog post “A chain is only as strong as its weakest link“.